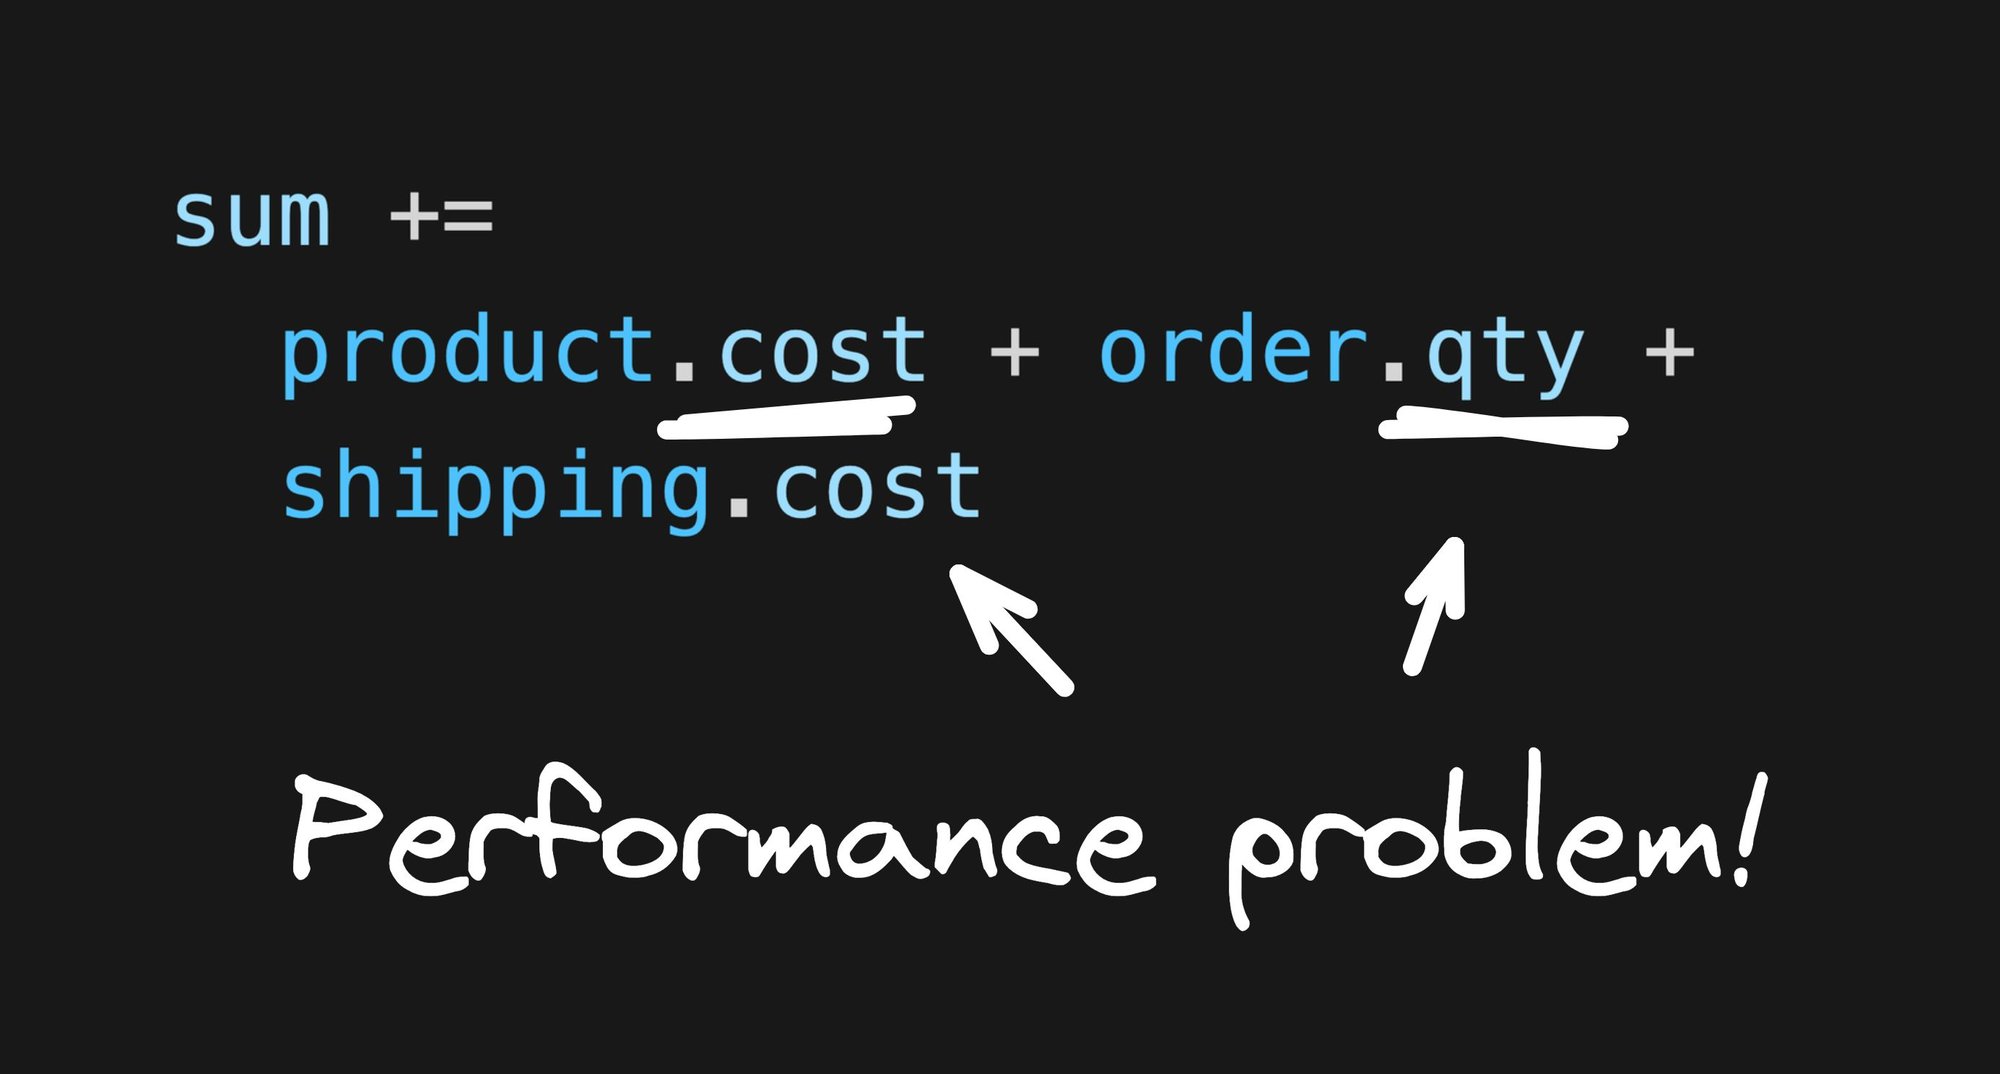
We discussed how monomorphic code could improve your JS execution time 60-fold! But it is hard to wrap your head around what exactly is going on in your code.
Would it not be great to have a tool to annotate your code with just such information? Lucky for you, Deoptigate is just such a tool!

Deoptigate is a tool that runs your application in node with special V8 flags. The V8 flags report on what is happening inside the JIT and write it to a file.
Deoptigate parses that information and converts it into human-readable form by merging it with your source code to give you a straightforward overview of what is going on in your codebase.
The best way to learn how to use a tool is with an example, so let me take you through it.
Deoptigate runs with all versions of V8 but it seems like it has trouble producing the correct output with newer versions. For this reason, this demo has been created with node v12.
- Install
node v12
To make testing easier, I have created a minimal example on GitHub that demonstrates a metamorphic property read.
The example creates a list of vehicles. The number of vehicles is fixed, but the type can be changed in the test.
The test creates many different object shapes by changing the type of vehicles we create. Too many object shapes overflows the inline-cache in the VM, as explained in Understanding Monomorphism to Improve Your JS Performance Up to 60x.
Re-running the tests with a different number of vehicles shows a significant difference in performance.
/*
 * Shapes |       μs  | Slowdown
 * -----------------------------
 *      1 |  8.10 μs  | 1.0  *
 *      2 |  9.71 μs  | 1.2  ***
 *      3 | 12.59 μs  | 1.5  ******
 *      4 | 12.90 μs  | 1.6  *******
 *      5 | 32.20 μs  | 3.9  ******************************
 *   many | 55.90 μs  | 6.9  ************************************************************
 */
The slowdown corresponds to the degree of polymorphism. The VM can handle fewer than four as part of inline-cache. However, as the number of shapes increases, the VM resorts to alternate caching strategies, that are much slower, until it ultimately gives up on caching all together.
Deoptigate can visualize this.
First, run the JavaScript using the CLI wrapper.
% deoptigate deoptigate-example.js Then examine the output by selecting the file.

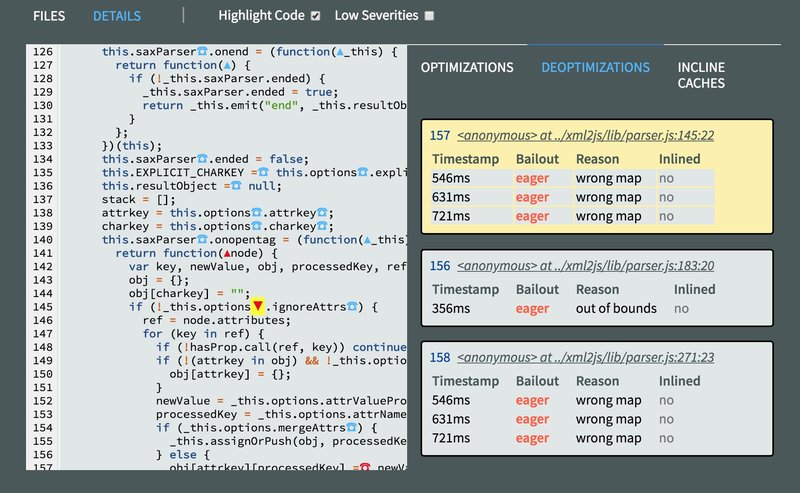
Notice that the Deoptigate has marked the vehicle.wheels access with a red mark. This indicates that the VM could not perform an efficient property read and has instead resorted to the slow path. Clicking on the mark shows these details:

The details show how the VM gradually transitioned from the fast path to the slow path as many different-shapes of objects passed under the property access:
uninitilized⇒monomorphic: the first object shape allowed the VM to inline-cache that object on the first execution.monomorphic⇒polymorphic: as more object shapes passed by, the size of the inline cache increased.polymorphic⇒megamorphic: as the number of shapes increased above 4, the VM has given up on the inline-cache strategy and transitioned to the global property cache. This is an undesirable state as it is a slow code path.
Deoptigate is a great tool to have at your disposal. It allows you to annotate your codebase with information showing problematic areas for VM. It quickly allows you to identify the location of the code which is metamorphic and, therefore slow. If the code is in the hot path it can have significant negative implications for the performance of your application.
The best way to guard yourself against this is to think about how many shapes of objects will each property access have and try to minimize it. A good strategy is to make sure that all objects have the same set of properties. If the property is un-needed just set it to undefined.
Builder.io visually edits code, uses your design system, and sends pull requests.
Builder.io visually edits code, uses your design system, and sends pull requests.


 Connect a Repo


